
On Halloween night, Poop Map went quiet wherever people go trick-or-treating. We also crowned the favorite costume, counted more than 40,000 knocks on throne room doors and found the morning-after hangovers.
Halloween 2026 fell on a Saturday, and for most of the day Poop Map looked like any other Saturday. Over the whole day, there were 1.9% more drops than on an average October Saturday.
Then night fell. In the countries that go trick-or-treating, drops between 7pm and midnight fell 19% below a normal Saturday evening. At 9pm, the quietest hour, they were down 25%.
Somewhere, a lot of bathrooms were waiting for their people to come home.
Everybody was out
We grouped six countries where trick-or-treating is a big tradition (the United States, Canada, the United Kingdom, Ireland, Australia and New Zealand) and compared every local hour of Halloween with the same hour on the four Saturdays before it: 3, 10, 17 and 24 October.
The evening dip stands far outside the usual noise. On those four ordinary Saturdays, the same evening hours never strayed more than 2.4% from the average of the other three. Continental Europe dipped too, but only by 5%.

The afternoon, meanwhile, was busier than usual. From noon to 6pm, drops in the trick-or-treat countries ran 9–14% above a normal Saturday, and the whole day ended 1.4% up. Going before you go out is good advice at any age.
| Country | 7pm–midnight | Usual range |
|---|---|---|
| United Kingdom | −23% | −1% to +1% |
| Australia | −19% | −6% to +4% |
| United States | −19% | −3% to +3% |
| Canada | −15% | −7% to +4% |
| Germany | −12% | −8% to +10% |
| Italy | −7% | −5% to +3% |
| Spain | −4% | −15% to +12% |
| Netherlands | −3% | −7% to +3% |
| France | −1% | −9% to +4% |
| Belgium | 0% | −11% to +10% |
The United Kingdom had both the deepest dip and the steadiest ordinary Saturdays. Germany fell 12%, but its Saturdays swing almost that much on their own. France and Belgium barely noticed.
The costume contest
On Halloween, 42.6% of all drops wore a Halloween sticker. Stickers of any kind were on 59.2% of drops, up from 46.9% on the Saturdays before.
| Costume | Share |
|---|---|
 Ghost | 38.3% |
 Jack-o'-lantern | 29.4% |
 Vampire | 11.1% |
 Pumpkin hat | 10.5% |
 Mummy | 4.5% |
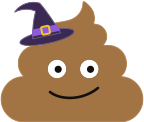 Witch | 3.1% |
 Candy corn | 3.0% |
The ghost won by a sheet. Fittingly, Poop Map already has a tag for the other kind of ghost poop, the one that needs no wiping: Wipeless wonder. Candy corn, the most argued-about candy of the season, came last.
The best-rated day in three months
Halloween drops averaged 3.32 stars, the highest of any day since 1 August. The four Saturdays before averaged 3.26.
Part of that is the stickers. Drops with a sticker rate higher anyway (3.39 stars on an ordinary Saturday, against 3.13 for bare ones), and Halloween had many more of them. But bare drops rose too, to 3.16.
Different people log on different days, so we also compared 33,373 people with themselves: everyone who logged on Halloween and on at least one of the four Saturdays before. On average, they rated their Halloween drops 0.10 stars higher than their ordinary Saturday ones (95% confidence interval: 0.09 to 0.11). 49% rated Halloween higher and 38% lower.
Halloween in their own words
“Halloween” appeared in 8.8% of public notes on the day, against 0.1% on the Saturdays before. “Spooky” (and “spoopy”) turned up in 8.2%. “Costume” was 11 times as common as usual, and “trick or treat” went from one mention across four Saturdays to 29 on the night.
“Candy” appeared in 19 public notes on Halloween and in 18 more on 1 November. On the four weekends before, it had shown up four times in total.
The morning after
On Sunday 1 November, “hangover” appeared in 1.3% of public notes, 2.6 times the rate on the four Sundays before, counting each Sunday up to the same hour.
The new Night out tag had its biggest day as well. On 1 November, it was on one in six drops that used one of the six new experience tags, up from one in thirty on Thursday 29 October.
The hour that happened twice
At 2am on 1 November, clocks in most of the United States and Canada went back to 1am. In the hour Americans lived twice, between 1 and 2am, Poop Map recorded 1.66 times as many US drops as on an ordinary Sunday.
The morning rush then came early: from 5 to 8am, US drops ran 38% above a normal Sunday, presumably because bodies were still on summer time. Europe did the same a week earlier, when its clocks went back on 25 October.
Trick or treat in the throne rooms
For Halloween, throne rooms opened their doors. Once a day per room, a visitor picks a treat for their own treat bucket or a trick that pranks the room for a day. Owners could put up a lantern to join the trick-or-treat street, a deck of lit throne rooms you swipe through from the map.
From the first knock at 01:03 UTC on 31 October to 22:26 UTC on 1 November:
- 41,048 knocks from 8,630 trick-or-treaters landed on 493 throne rooms, and 663 owners put up a lantern.
- Poop Mappers are mostly nice: 56.7% of knocks chose a treat and 43.3% a trick. 17% of trick-or-treaters played only tricks; 20% only ever took treats.
- Treats are random, and some houses had clearly run out of candy: 3,714 treats were emergency plungers, 2,861 were toothbrushes and 2,796 were a single square of toilet paper.
- Pranks stuck around. Owners cleaned up only 2.8% of them, and those who did took a median of 48 minutes.
- The busiest throne room answered the door 2,858 times. The most dedicated trick-or-treater knocked 76 times.
- Visitors flushed each other’s throne-room toilets 1,204 times on Halloween, eight times an ordinary day, and 3,098 times on 1 November before the day was even over.
Knocking ends at 23:00 UTC on 2 November. Treat buckets stay on show for a week after that.
A badge for the brave
27,092 people earned the Spoopy Pooper badge for the first time this Halloween. It goes to anyone who drops a pin on 31 October, local time.
How we counted
- We counted drops from registered accounts, leaving out deleted drops and accounts we have removed or restricted.
- Every time is local: the drop’s recorded time plus its own saved UTC offset.
- Halloween is compared with the average of the four Saturdays before it. The usual range compares each of those Saturdays with the other three.
- Countries come from where a pin was dropped, not from the account. Continental Europe covers 27 countries from Portugal to Finland. Ireland and New Zealand are in the trick-or-treat group but have too few evening drops for a row of their own: the table lists countries with at least 200 drops on an ordinary Saturday evening.
- Words come only from public notes, the notes people share with the world. We counted matching words; nobody read the notes.
- The same-person rating comparison gives every person equal weight.
- The six newest experience tags reached the apps only in late October, so their use is still growing.
This is recorded activity, not medical research: a quiet hour on Poop Map does not prove anyone held it in. Explore the aggregate data.
Next Halloween, the ghost will be waiting. Start your own Poop Map.